Product Manager, then Senior Product Manager, Shipping and Transportation · ShipMonk · 2026
Three apps, and the arithmetic behind 4,000 hours
The fixed constraint
Engineering time belongs to the ShipMonk platform. These apps sit outside that monolith, which is why a product manager could build them, and why they had to be safe enough to run without one.
Situation
Three jobs on the Transportation team ran on tooling I had built myself out of Metabase cards, Google Sheets, and Zapier.
The first was analytics. Carrier cost, margin, on-time delivery, and service exceptions lived in a stack of cards that someone assembled by hand every week, and the margin bridge was a manual analyst exercise on top of that.
The second was the dock. Freight sitting too long on a gaylord is money and a service failure at the same time, and finding it meant people walking the floor and opening tickets by hand, until I automated a version of it in Zapier and Sheets.
The third was one-off labels. When the standard order flow cannot produce a label, someone goes into a carrier portal by hand or files an engineering request.
All three worked. None of them were stable, and every one of them had me as a single point of failure.
Constraint
Engineering capacity goes to the ShipMonk platform, and none of this was ever going to compete for it. These three sit outside that monolith, which is what made them mine to build and what let them move faster than platform work can. I built them on my own time, partly as a bet on what Claude Code could actually do.
That freedom set the requirement. Anything I shipped had to survive me: legible to the team, durable enough to run daily, and safe enough to sit in front of production. One of the three creates labels on the live carrier account with real spend attached, so a bug there is not a bad chart, it is a charge.
What I did
Three applications, all Next.js on Vercel with Neon behind them, all written with Claude Code.
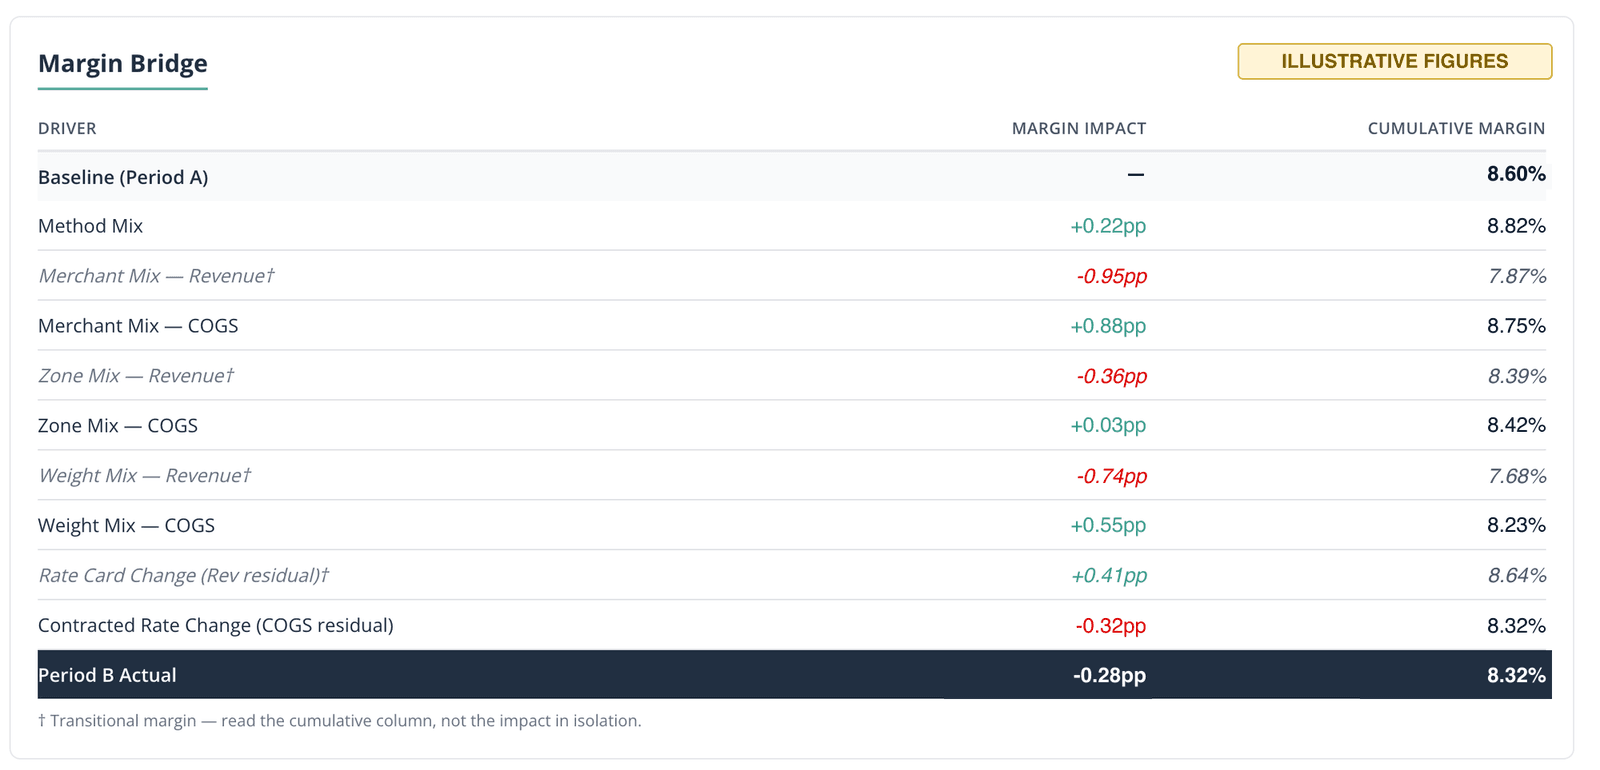
ts-dashboard-v2 carries carrier cost, margin, on-time delivery, service exceptions, and the weekly margin bridge in one place on scheduled refreshes. It is used by me, my product manager, and the four Transportation lane owners.
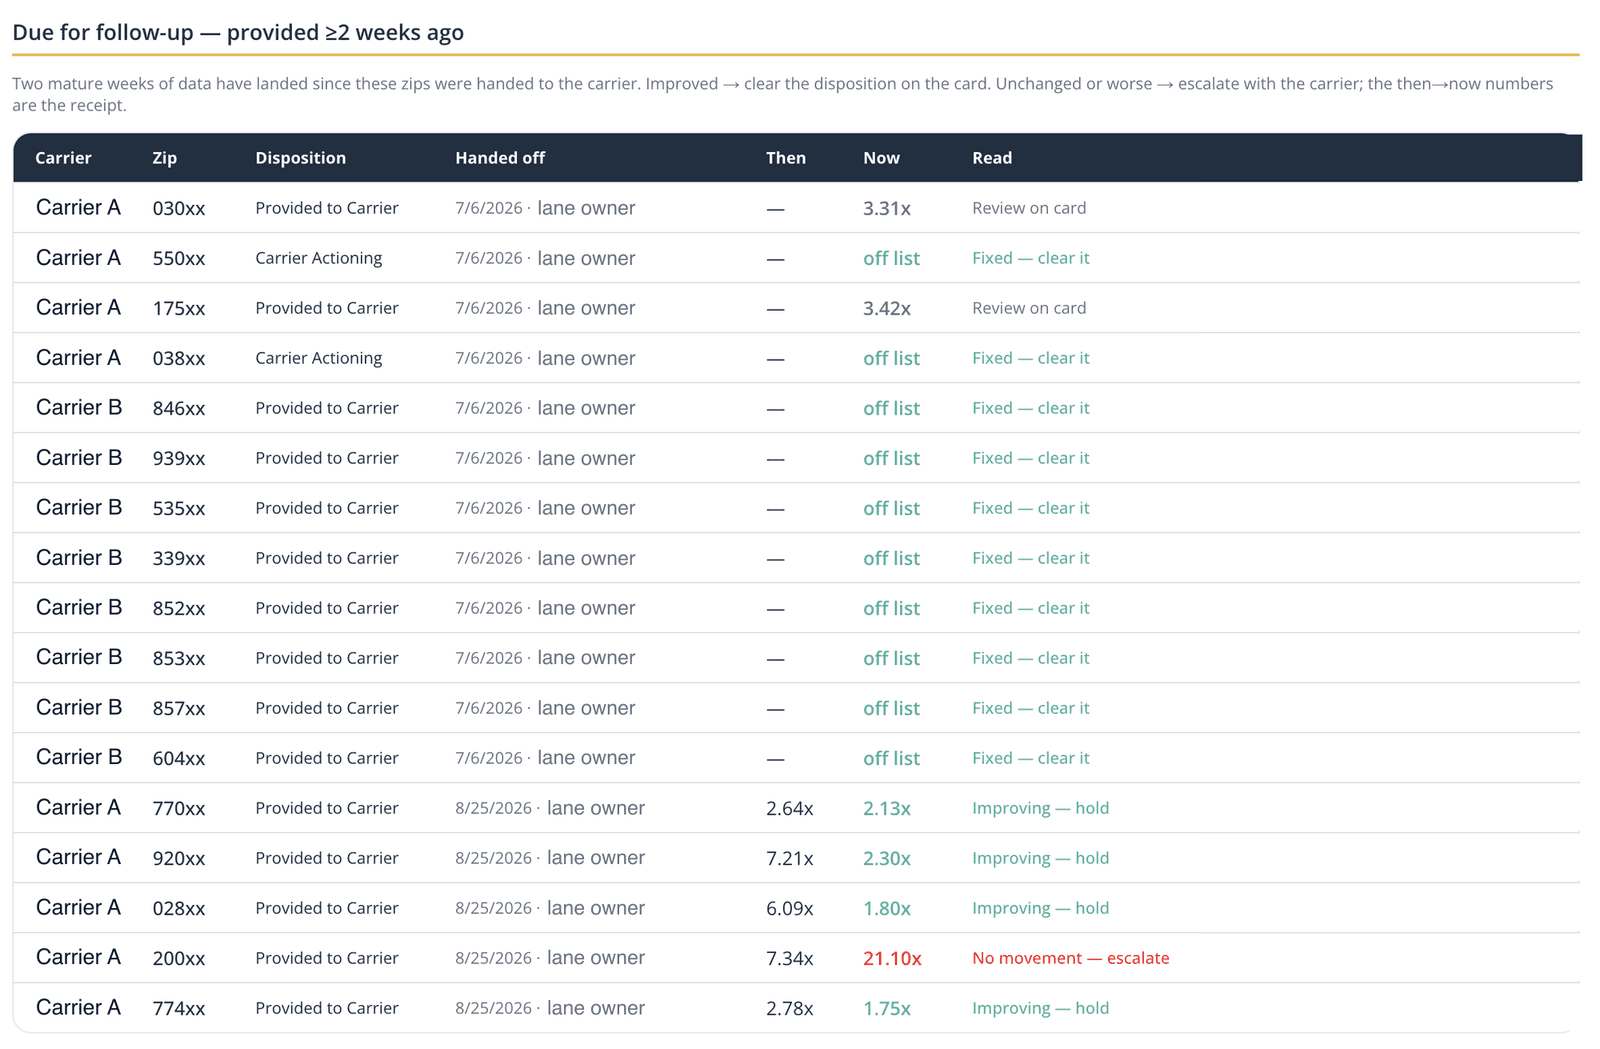
carrier-scheduling tracks scheduled pickups against what carriers actually do, detects freight sitting on the dock too long, and opens the escalation ticket itself. Warehouse operations uses it daily, and lane owners use it when a carrier in their lane surfaces.
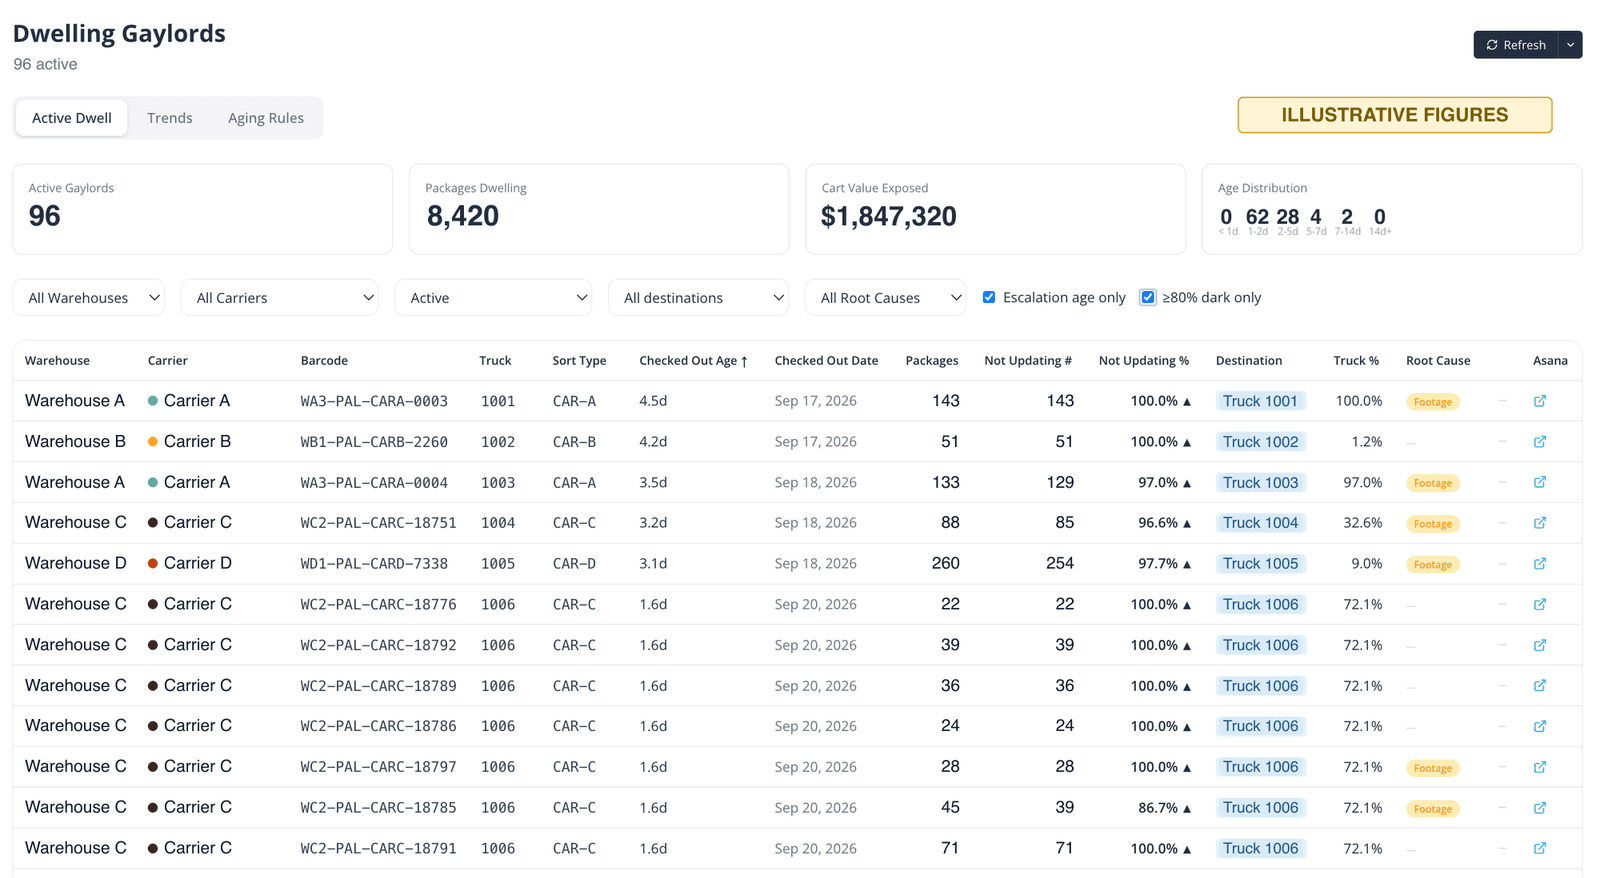
manual-label-creation produces a shipping label outside the normal order flow when the standard path cannot. It runs on the production carrier account.
The no-code versions were not a false start. They were phase one of the same work, and they are the reason the applications knew what to build: the Sheets and the Zapier flows had already found the edge cases.
Result
Over the 167 days from the first commit on 3 April 2026 to the count on 17 September, the tools take out roughly 2,030 hours, which annualizes to about 4,440. The honest version of that number is a range, between roughly 2,200 and 4,400 hours a year, and the reason is worth more than the figure.
The count is bottom-up, volume times a per-task time base, not a before-and-after time study and not a team estimate. The largest components:
- 62,358 gaylords reviewed, at 1 minute each
- 7,539 escalation tickets opened automatically, at 3 minutes each
- 29 margin bridge runs, weekly plus month over month, at 1.5 analyst days each
- 583 automation config edits, at 10 minutes each
- the remainder in recurring operational and scorecard runs
The volumes are hard counts out of the application database. The minute bases are my estimates, and I set them low on purpose. Pulling the old gaylord report took more than a minute before anyone looked at a single gaylord, so 1 minute per gaylord is conservative. At 2 minutes, which I think is closer to the truth, the same arithmetic gives roughly 6,700 hours a year. I quote the lower one.
The gap between those two bounds is the gaylord review, 62,358 of them at a minute each, which is the largest line item and the one worth arguing about. Before any tooling, nobody was reviewing gaylords at all; the dock got attention when a merchant complained about a late package, and a Metabase report of packages missing scans got worked backwards from there. Under the no-code version I built, a task opened for every gaylord that crossed its tier threshold, and a person worked those one at a time. So some of that minute per gaylord is real hours somebody used to spend, and some of it is work nobody was doing. The upper bound credits a minute to every gaylord the tool now reviews. The lower bound credits none of it and counts only the escalations and the recurring runs. Both are on the table because I cannot split them cleanly.
Two things are excluded deliberately. Anything the tools do that nobody did before earns zero hours, because zero hours were being spent, and that is a meaningful share of the value. And there is no software cost-avoidance figure, because the no-code platform these displaced was on a plan sized for far more than my automations and was never cancelled.
One note on the baseline, because it is the first thing I would ask. I built the Metabase reports, the Sheets, and the Zapier flows too. The baseline here is no tooling at all rather than my own earlier prototype, because the whole chain is one body of work shipped in two phases.
What I would do differently
The first version of the carrier view inside ts-dashboard-v2 is the dashboard I later wrote about as the one that changed nothing. It was accurate, it was fast, people opened it, and it did not change what anyone did on Monday. The fix was structural rather than visual: make the unit of work the decision, with an owner and a documented action, instead of the summary.
I would ask that question before building rather than after. Which decision does this change, who makes it, and what do they do differently because it exists. Now it is the acceptance criterion rather than the retrospective.